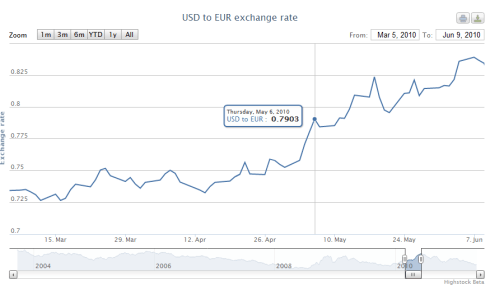
While extending the Company performance page, a new charting library was needed to show the revenue and the number of orders for a certain time period. This time we decided to use an interactive graph, almost like the one used for Google Analytics. Currently we just have a static picture of the graph on the performance page. Every date range change needs a complete page reload and there are no interactive features.
Much faster library
The graphing library that will be used in the new performance page allows direct user interaction and has many convenient features. For example, it displays the value of the x- and y-axis when you hoover over a graph with the mouse (tooltip), and you can zoom in and out. Unlike the old graph library, this one loads the complete data needed to chart every possible date range at once. Therefore, when the user wants to see different date ranges, the graph can be rendered again on the browser without having to reload the page or receive data from the server. As a result, this library is much faster than the original one.
There are many javascript charting libraries available online, and in order to choose the most appropriate library, I compared the candidates on a few factors.
The features of the different charting libraries vary from only simple features such as just showing the graph, to dynamic, user interactive features such as zooming and tooltips, and optional features like data analysis.
Works with all browsers
The compatibility of the charting library is important – this is related to whether the graph is properly rendered in different web browsers such as IE, Chrome, FireFox, Opera, etc. and mobile devices like smart phones and tablets. This factor usually depends on what the library is implemented in, for example javascript, html, flash and such. If it uses flash, it will have trouble rendering in some browsers and mobile devices. How sophisticated and user-friendly the UI (user interface) design is, is a somewhat personal factor, depending on the taste of the individual.
After some consideration and comparison we decided to use the javascript library Highcharts Stock, which got the highest score in our choosle comparison.
Title image: Screenshot highcharts.com
